NorthWest Healthcare REIT (NWH.UN) Analysis: Deep Value or Value Trap?
NorthWest Healthcare REIT Stock Analysis: Trading Below Book Value – February 27, 2026
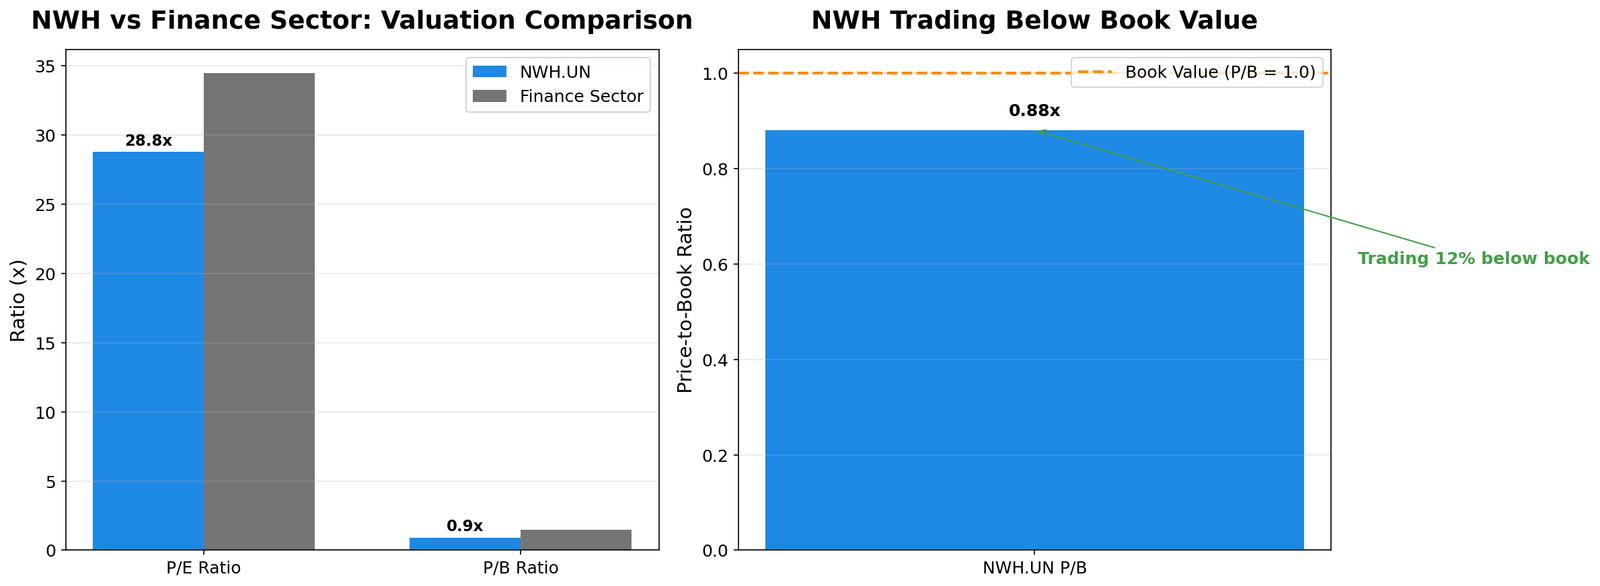
TL;DR: NorthWest Healthcare REIT (NWH.UN) trades at $5.72, 12% below book value, with a 6.4% dividend yield. But revenue is declining 13%, payout ratio is 180%, and debt is high at 1.79x equity. This is either a deep value opportunity or a value trap. Here’s the full analysis.
The Setup: Trading Below Book Value
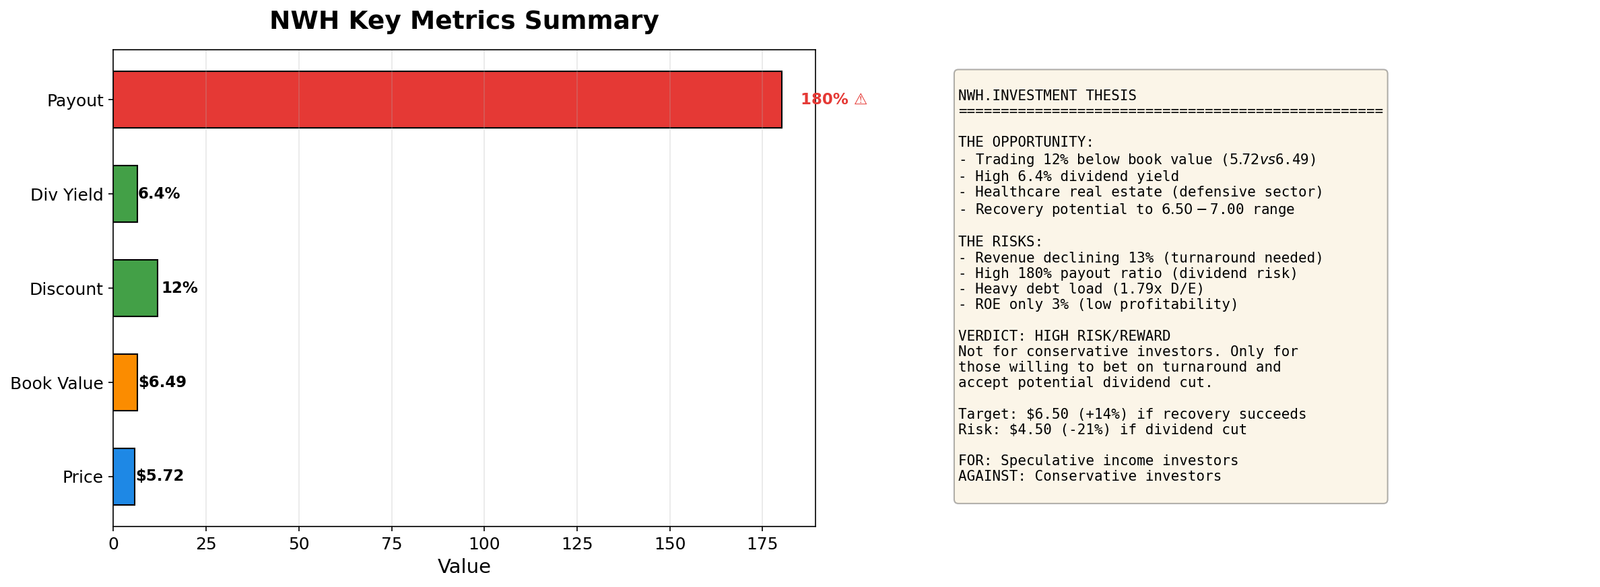
NWH.UN currently trades at $5.72 per share with a price-to-book ratio of just 0.88x. This means:
- Book value per share: $6.49
- Current price: $5.72
- Trading 12% below book value
- Market cap: $1.4 billion
The core question: Is this a bargain basement healthcare REIT, or a classic value trap?
The Asset: Healthcare Real Estate
Before analyzing the price, let’s understand what you actually own:
- Asset Class: Healthcare real estate investment trust (REIT)
- Hospitals, medical offices, clinics
- International portfolio (Canada, Europe, Australasia)
- Defensive sector (healthcare)
- Market Cap: $1.4 billion
- Key Stats:
- Total Revenue: $433M (TTM)
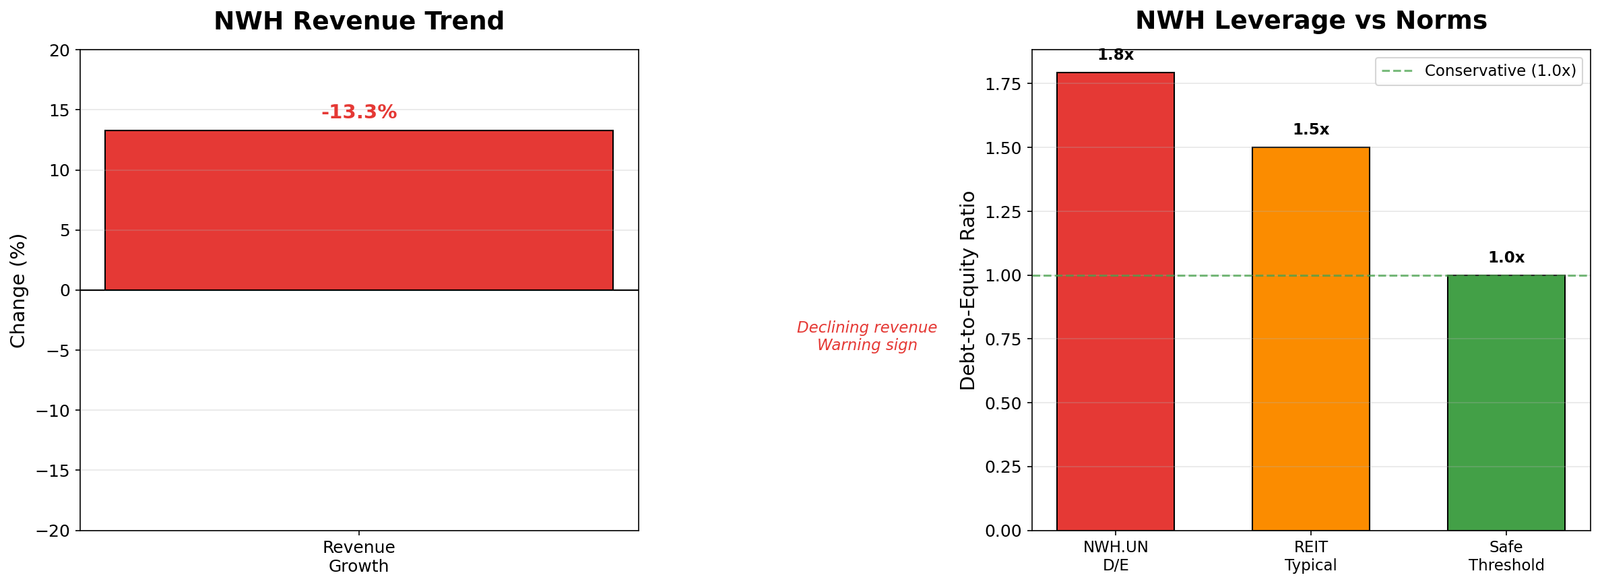
- Revenue growth: -13.3% (declining)
- Gross margin: 74.4%
- Operating margin: 55.9%
- P/E: 28.8x
- P/B: 0.88x (below book)
- Dividend yield: 6.44%
The Valuation: Below Book But Risky
At 0.88x P/B, NWH is trading below book value:
- P/B Ratio: 0.88x (40% below sector average of 1.46x)
- Dividend Yield: 6.44% vs sector 4.45% (45% premium)
- Revenue Growth: -13.3% (red flag)
- ROE: 3.04% (very low)
The discount exists because the market is pricing in risk. Trading below book is rare for REITs and usually signals trouble.
The Red Flags: Why It’s Cheap
NWH trades below book for reasons:
- Declining Revenue: -13% year-over-year
- Low Profitability: ROE of 3% is terrible for a REIT
- High Leverage: Debt-to-equity of 1.79x is aggressive
- Dividend Risk: Payout ratio of 180% (not covered by earnings)
- 5-Year Performance: -57% (massive destruction of value)
This isn’t a hidden gem. The market knows something is wrong.
The Math: Recovery Scenarios
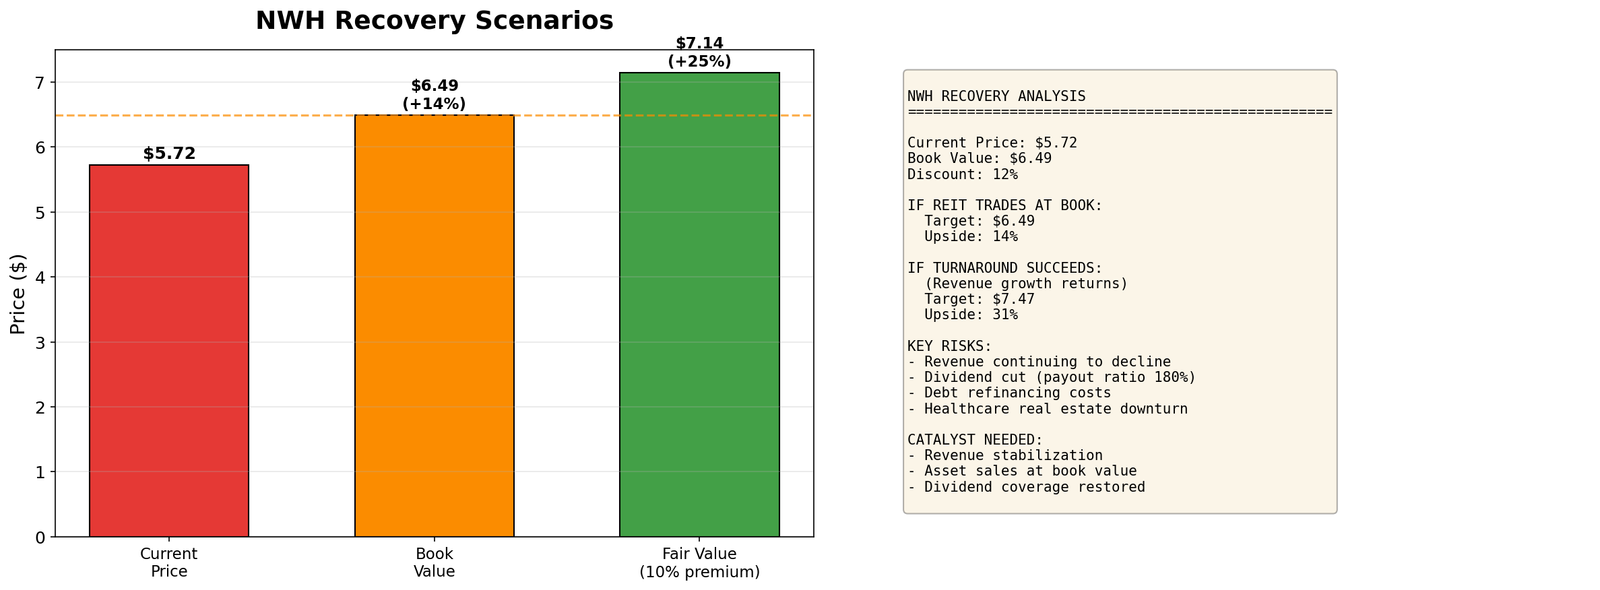
Current price: $5.72 | Book value: $6.49
| Scenario | Target Price | Upside |
|---|---|---|
| Trade to Book Value | $6.49 | +13% |
| Fair Value (10% premium) | $7.14 | +25% |
| Turnaround Success | $8.00 | +40% |
| Dividend Cut (bear case) | $4.50 | -21% |
The Reality: Even reaching book value requires confidence to return. That’s a big if.
Why It Could Work (Bull Case)
- Below Book Value: Asset values support the price
- High Yield: 6.4% dividend while you wait
- Defensive Sector: Healthcare real estate tends to be stable
- Turnaround Potential: New management could improve operations
- Recent Strength: +12% YTD vs -57% over 5 years (momentum shift?)
What Could Go Wrong (Bear Case)
- Dividend Cut: 180% payout ratio is unsustainable
- Continued Decline: Revenue keeps dropping
- Debt Pressure: High leverage becomes a burden in high rate environment
- Asset Write-Downs: Book value might be overstated
- Value Trap: Cheap for a reason – could get cheaper
Bottom Line: The Verdict
NWH is a speculative turnaround bet, not an investment.
For Income Investors: The 6.4% yield is tempting but risky. A dividend cut would crush the stock. Better REITs exist.
For Value Investors: Trading below book is interesting, but only if assets are worth book. Needs deep due diligence.
For Growth Investors: This is the opposite of what you want. Declining revenue, low ROE.
My Take:
NWH is a high-risk, potentially high-reward speculation. The discount to book and high yield create a tempting entry, but the declining revenue and unsustainable payout ratio are serious red flags. This is only for investors willing to bet on a turnaround and accept potential capital loss.
Verdict: Pass for most investors. If you must speculate, keep position small (under 2% of portfolio), use limit orders below $5.50, and set a stop loss at $4.75. This is not a core holding.
Key Metrics Summary
| Metric | Value | Context |
|---|---|---|
| Price | $5.72 | Below book |
| P/B Ratio | 0.88x | 40% below sector |
| Dividend Yield | 6.44% | High but risky |
| Revenue Growth | -13.3% | Declining (red flag) |
| Payout Ratio | 180% | Not sustainable |
| Debt/Equity | 1.79x | High leverage |
| 5-Year Return | -57% | Massive underperformance |
Important Disclosures
This analysis is for informational and educational purposes only. It does not constitute investment advice. Always conduct your own research and consult with a qualified financial advisor before making investment decisions. Data sourced from TradingView. Analysis date: February 27, 2026.
Author does not hold positions in securities mentioned. Past performance does not guarantee future results. Investing in REITs involves risks including potential for significant capital loss.