BCE (Bell Canada) Stock Analysis: Deep Value or Value Trap?
BCE (Bell Canada) Stock Analysis: Deep Value or Value Trap? – February 24, 2026
TL;DR: Canada’s largest telecom trades at 5.3x P/E—less than half its historical average. Either this is the opportunity of a decade, or the market knows something we don’t. Here’s the complete analysis:
The Setup: An Extreme Valuation
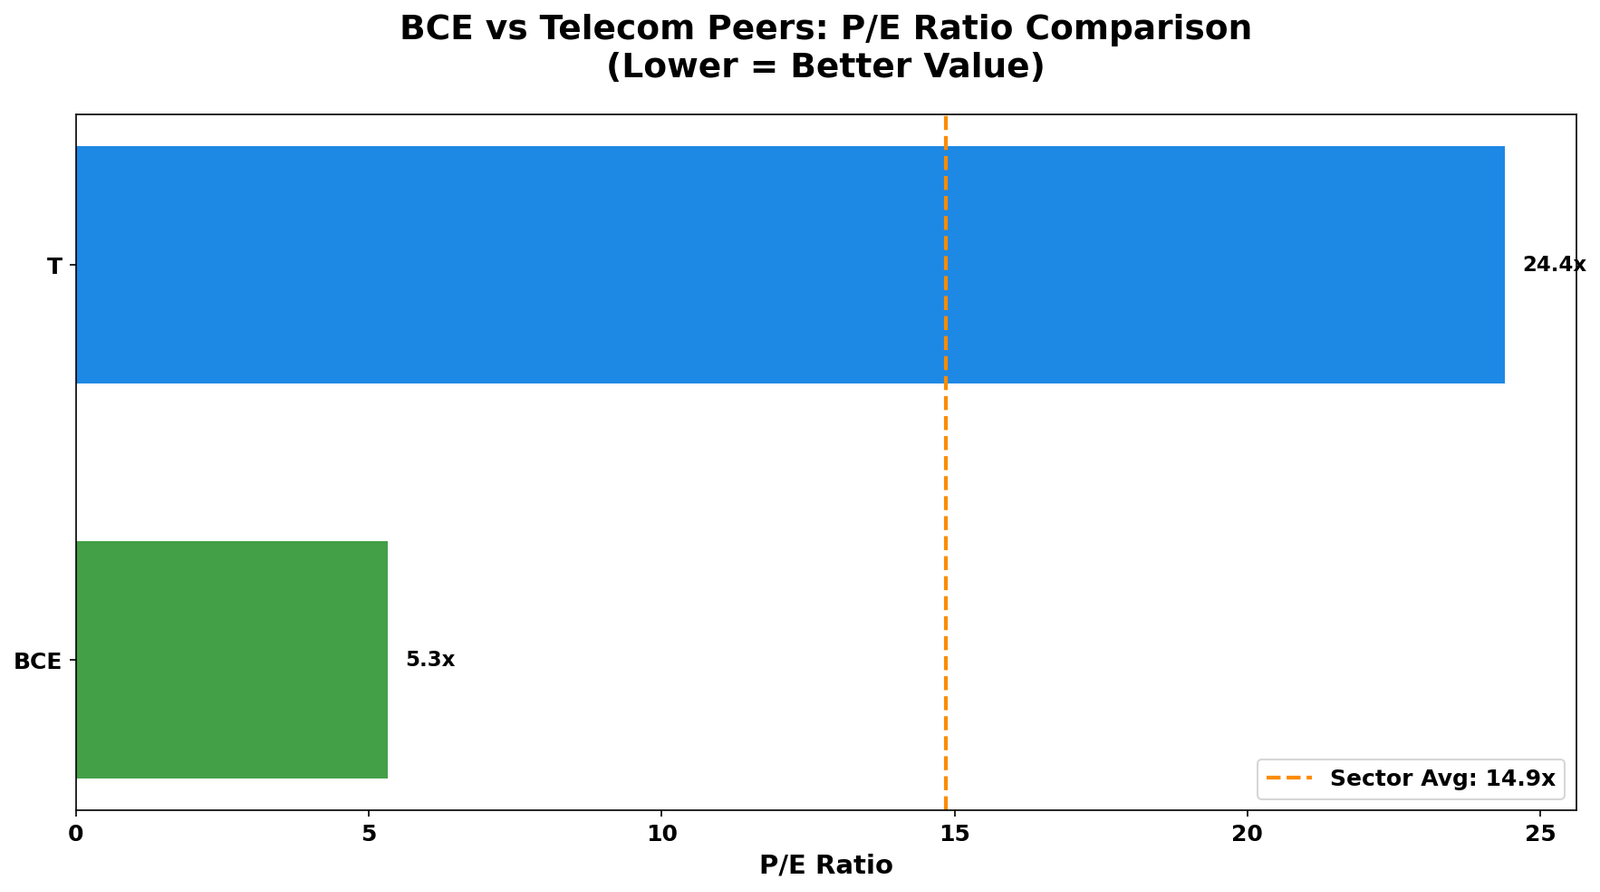
BCE Inc. (TSX: BCE), better known as Bell Canada, currently trades at just 5.3x P/E. To put that in perspective:
- Historical average P/E: 10-12x
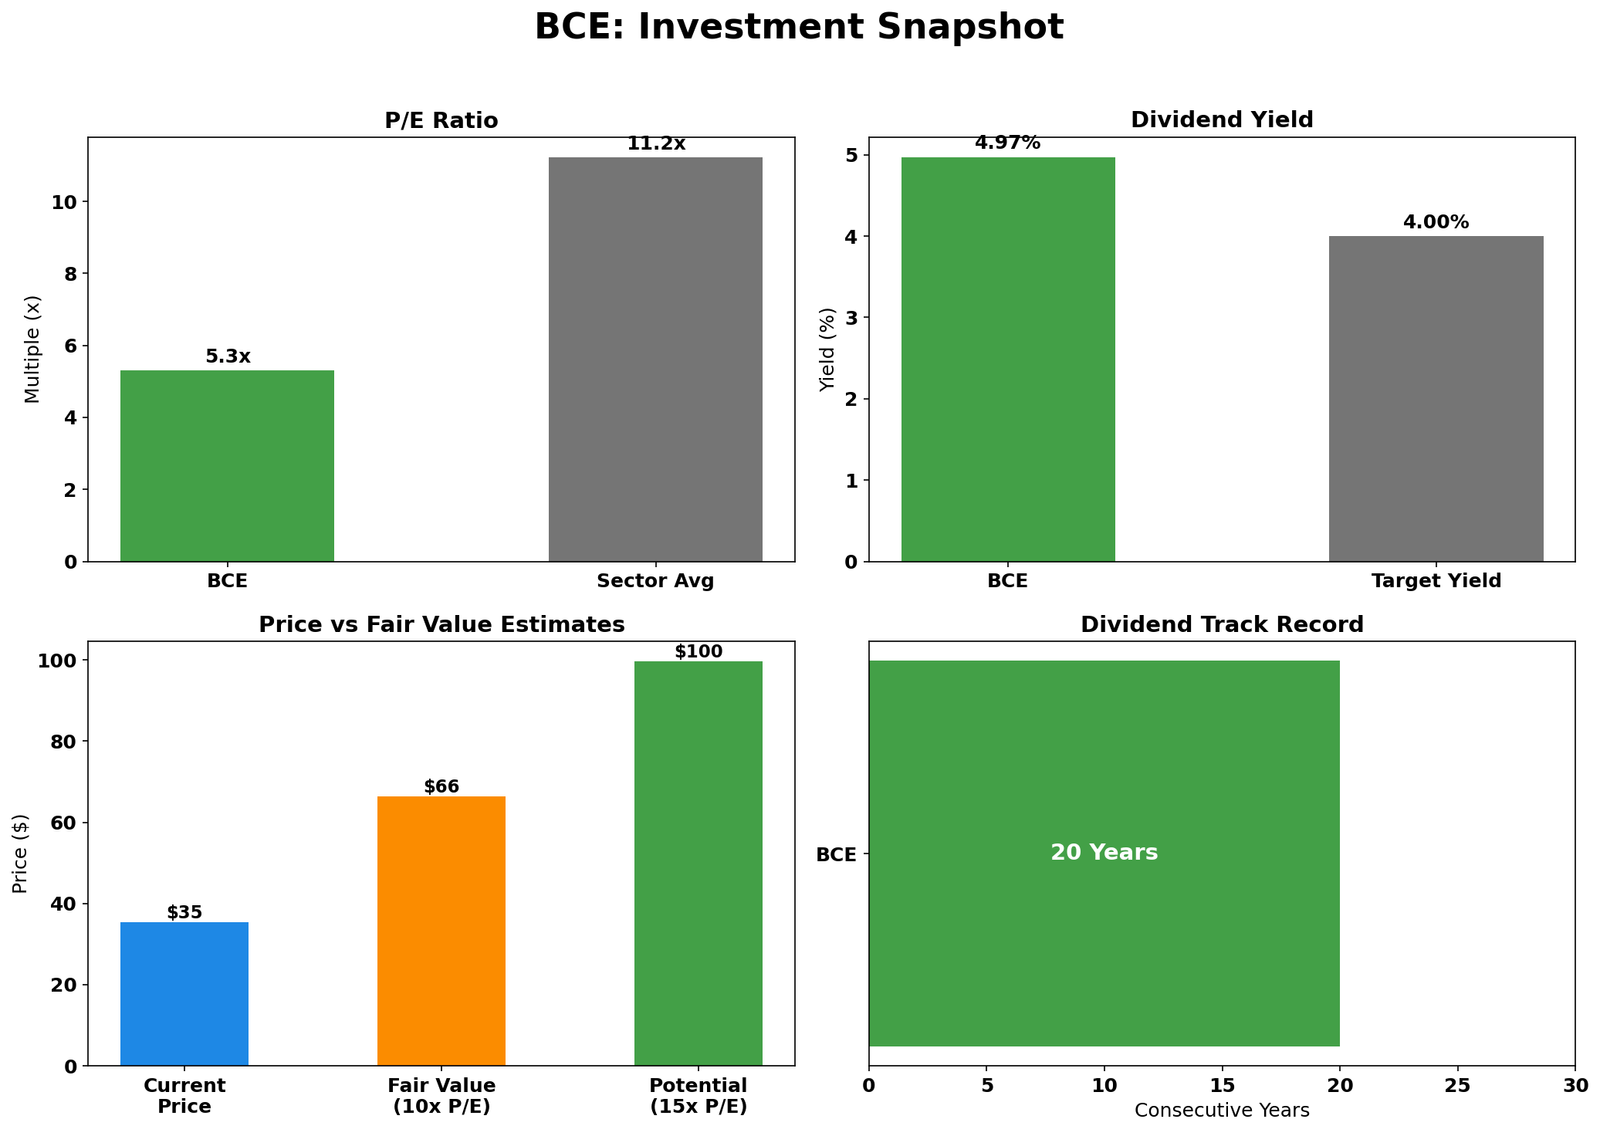
- Sector average today: 11.2x
- BCE’s current multiple: 5.3x (52% discount)
This isn’t just cheap—it’s historically cheap. In 20 years, BCE has rarely traded below 8x P/E. We’re now at 5.3x.
The core question: Has something fundamentally broken at Bell, or has the market simply lost its mind?
The Asset: Canada’s Premier Communications Infrastructure
Before analyzing the price, let’s understand what you actually own when you buy BCE stock:
- Founded: 1880 (145+ years of operation)
- Market Cap: $32.8 billion (Canada’s largest telecom)
- Network: 99% Canadian population coverage
- Subscribers: 10M+ wireless, 4M+ internet
- Business: Four segments:
- Wireless (60% EBITDA margins): Duopoly with Rogers—regulatory barriers protect returns
- Wireline: Fiber optic infrastructure with massive replacement costs
- Media: CTV, Crave streaming—content bundling strategy
- Business Solutions: Enterprise services, fastest growing segment
Key Insight: This is essential infrastructure, not a speculative tech play. People don’t cancel cell phones during recessions. The moat is substantial and protected by regulation.
The Controversy: Why Is It So Cheap?
The market doesn’t give away 50% discounts for no reason. Here are the legitimate concerns driving the low valuation:
- Dividend Sustainability Risk: 90%+ payout ratio leaves almost no cushion
- Debt Burden: Billions to refinance; high-rate environment pressured cash flow
- Cord-Cutting: TV subscriber losses accelerating
- Competition: Rogers-Shaw merger created uncertainty
- Slow Growth: Wireless market mature; subscriber additions slowing
The fear is simple: If earnings decline even slightly, the 4.97% dividend could be at risk—and if the dividend gets cut, the stock crashes regardless of fundamentals.
How We Got Here: A Story of Multiple Compression
Understanding the price history is crucial:
The Pattern:
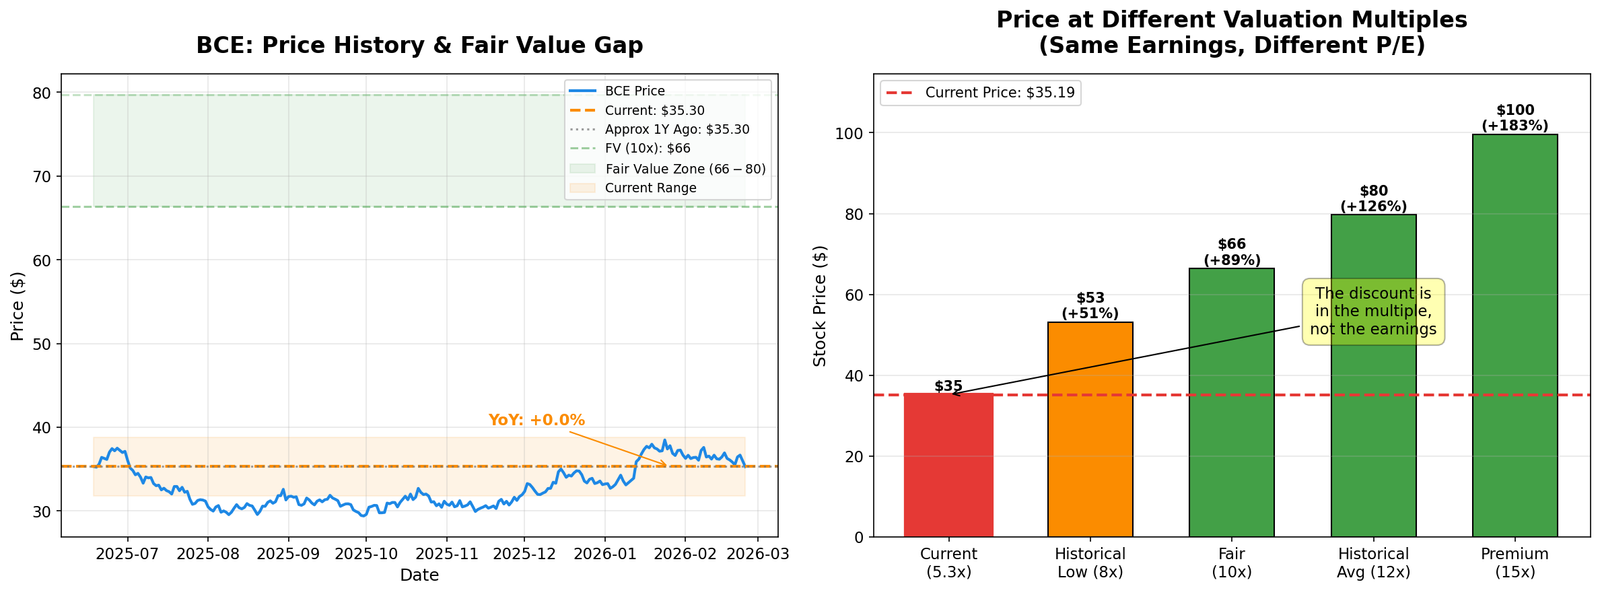
- BCE’s stock price fell primarily due to multiple compression, not earnings collapse
- Same business earning similar profits, but investors paying less per dollar of earnings
- Current 5.3x P/E is near the lowest in 20 years
The Opportunity:
If BCE simply returns to 10x P/E (still below historical average):
- Stock price: ~$66 (88% upside)
- Plus 5% annual dividend yield
- Total return: ~93%
If the market is wrong about the dividend risk and the multiple normalizes, patient investors are looking at substantial gains.
The Numbers: Multi-Metric Valuation Analysis
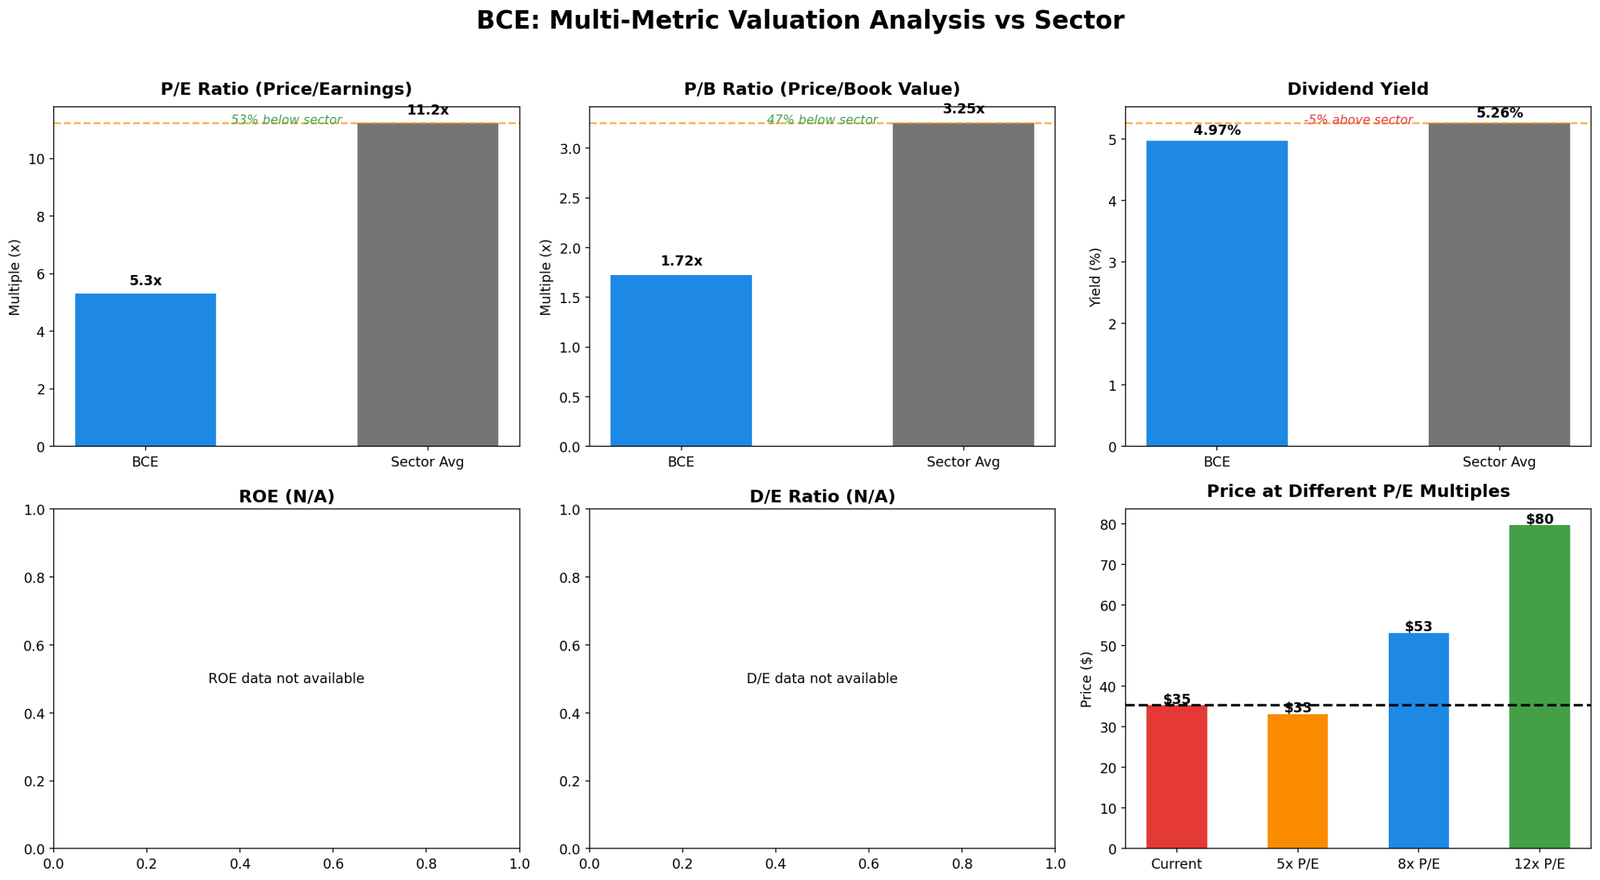
Looking beyond just P/E ratio:
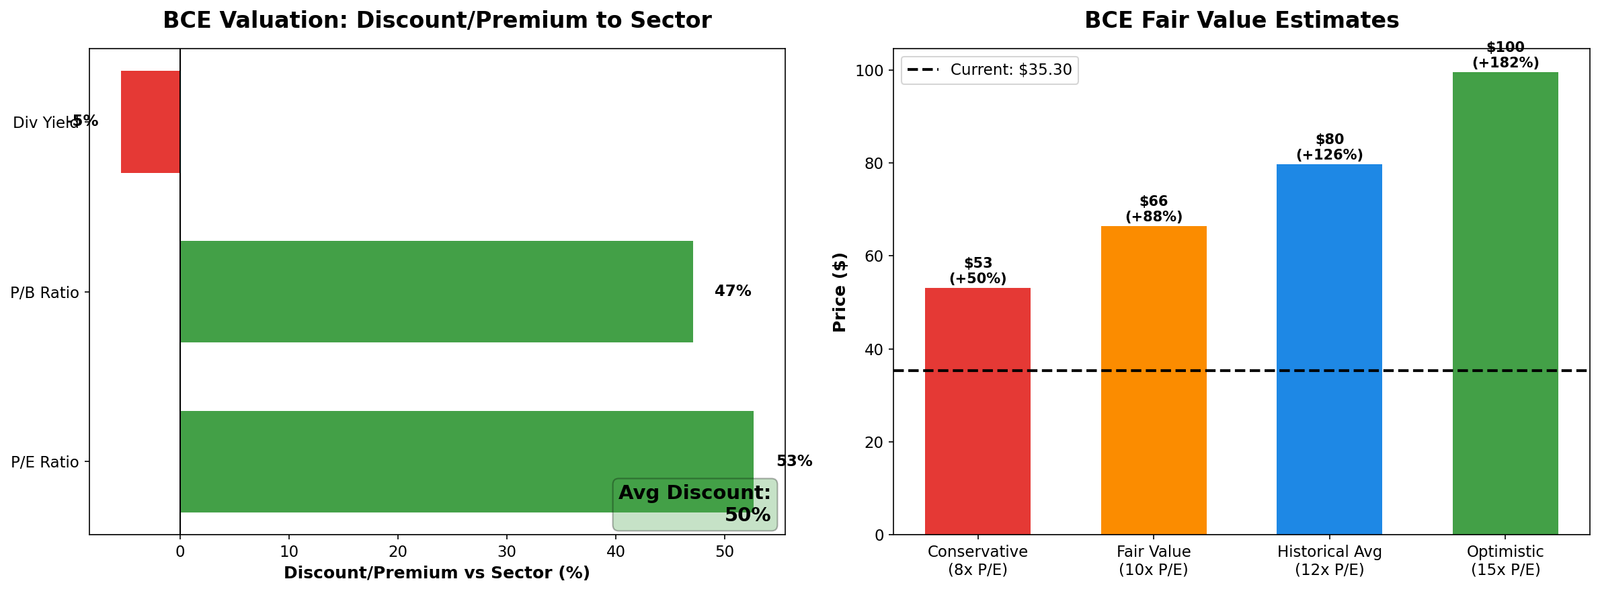
| Metric | BCE | Sector Avg | Discount |
|---|---|---|---|
| P/E Ratio | 5.3x | 11.2x | -53% |
| P/B Ratio | 1.72x | 3.25x | -47% |
| Dividend Yield | 4.97% | 5.26% | Competitive |
Why It Could Work (The Bull Case)
- Rate Cuts Are Here: Bank of Canada is cutting rates. Lower rates = cheaper debt service = more cash flow. Every 25bp cut helps Bell’s bottom line.
- Valuation Extreme Even for Bad News: Even if earnings decline 20%, BCE would still be cheap at today’s prices. The market is pricing in disaster-level outcomes.
- Mean Reversion: 5x P/E has historically been unsustainable. Either the business deteriorates (supporting low multiple) or the price rises.
- Income Demand: With GICs offering 3%, a 5% yield from a blue-chip should attract buyers.
- Rogers Integration Mess: Competitor distractions = potential market share gains for Bell.
What Could Go Wrong (The Bear Case)
- Dividend Cut: If earnings decline or debt service spikes, the 90% payout ratio becomes unsustainable. A dividend cut would crush the stock 30-40%.
- Structural Decline: Cord-cutting accelerates, wireless pricing war erupts, margins compress permanently.
- Recession: Economic downturn hits business solutions segment harder than expected.
- Multiple Stay Compressed: Even if earnings stabilize, market may permanently rerate telecoms lower.
The Math: Fair Value Scenarios
Current price: $35.30 | EPS: ~$6.64
| Scenario | P/E Multiple | Target Price | Upside |
|---|---|---|---|
| Conservative | 8x | $53 | +50% |
| Fair Value | 10x | $66 | +88% |
| Historical Avg | 12x | $80 | +126% |
| Optimistic | 15x | $100 | +182% |
Downside: If dividend gets cut, stock could drop to $25-30 (-15% to -25%)
Risk/Reward: Risking ~15% downside for 80-120% upside. Asymmetric bet.
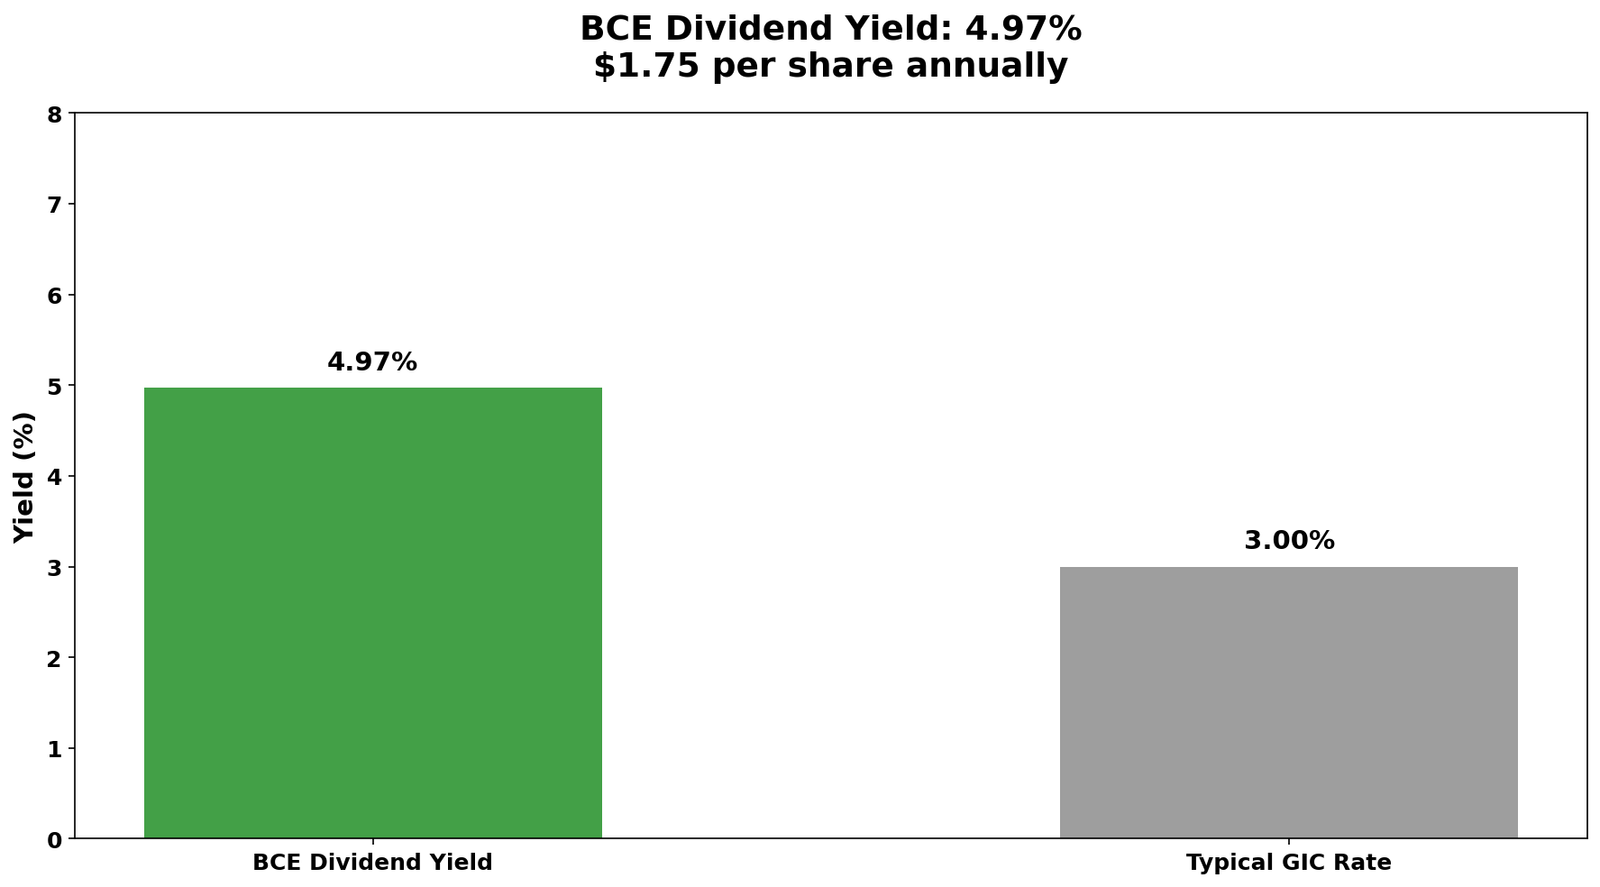
The Income Play: Dividend Yield Analysis
Even ignoring price appreciation, the income case is compelling:
- Annual Dividend: $1.75/share (4.97% yield)
- $10,000 Investment: ~$497/year in dividend income
- vs 5-Year GIC: ~$300/year at 3%
- Extra Income: +$197/year (+66% more)
And with GICs, your return is capped. With BCE, you get the income PLUS potential capital appreciation if the multiple normalizes.
Bottom Line: Deep Value or Value Trap?
This is NOT a stock that will 10x your money. It’s also not going to stay at 5x P/E forever.
For Income Investors: The 5% dividend yield is attractive. Even if the stock goes nowhere for 5 years, you’ve collected 25% in dividends. If it eventually re-rates to 10x P/E, you get another 88% on top.
For Growth Investors: Look elsewhere. This is too boring for you.
For Value Investors: This is exactly the kind of asymmetric setup—limited downside, substantial upside—that builds long-term wealth.
My Take:
BCE is a coiled spring disguised as a value trap. The market is pricing in worst-case scenarios that may not materialize.
The dividend looks sustainable with rate cuts providing a tailwind. The core business is resilient. And at 5.3x P/E, even modest good news could spark a significant re-rating.
Verdict: Cautiously bullish. This belongs in a dividend-focused portfolio as an asymmetric bet. Size accordingly—don’t bet the farm, but don’t ignore it either.
Key Metrics Summary
| Metric | Value | Context |
|---|---|---|
| Price | $35.30 | Near multi-year lows |
| P/E Ratio | 5.3x | 52% below sector avg |
| P/B Ratio | 1.72x | 47% below sector avg |
| Dividend Yield | 4.97% | Beats GICs by 65% |
| Market Cap | $32.8B | Canada’s largest telecom |
| Consecutive Div Years | 20 | Through 2008, COVID |
Important Disclosures
This analysis is for informational and educational purposes only. It does not constitute investment advice. Always conduct your own research and consult with a qualified financial advisor before making investment decisions. Data sourced from TradingView and company filings. Analysis date: February 24, 2026.
Author may hold positions in securities mentioned. Past performance does not guarantee future results.