TD Bank Stock Analysis: Premium Quality at Fair Value
TD Bank Stock Analysis: Premium Quality at Fair Value – February 25, 2026
TL;DR: Toronto-Dominion Bank (TD) trades at 11.2x P/E—slightly below sector average despite superior franchise quality and U.S. growth exposure. This is one of Canada’s “Big Six” banks with 170 years of history. Here’s the complete analysis:
The Setup: Canada’s Second Largest Bank
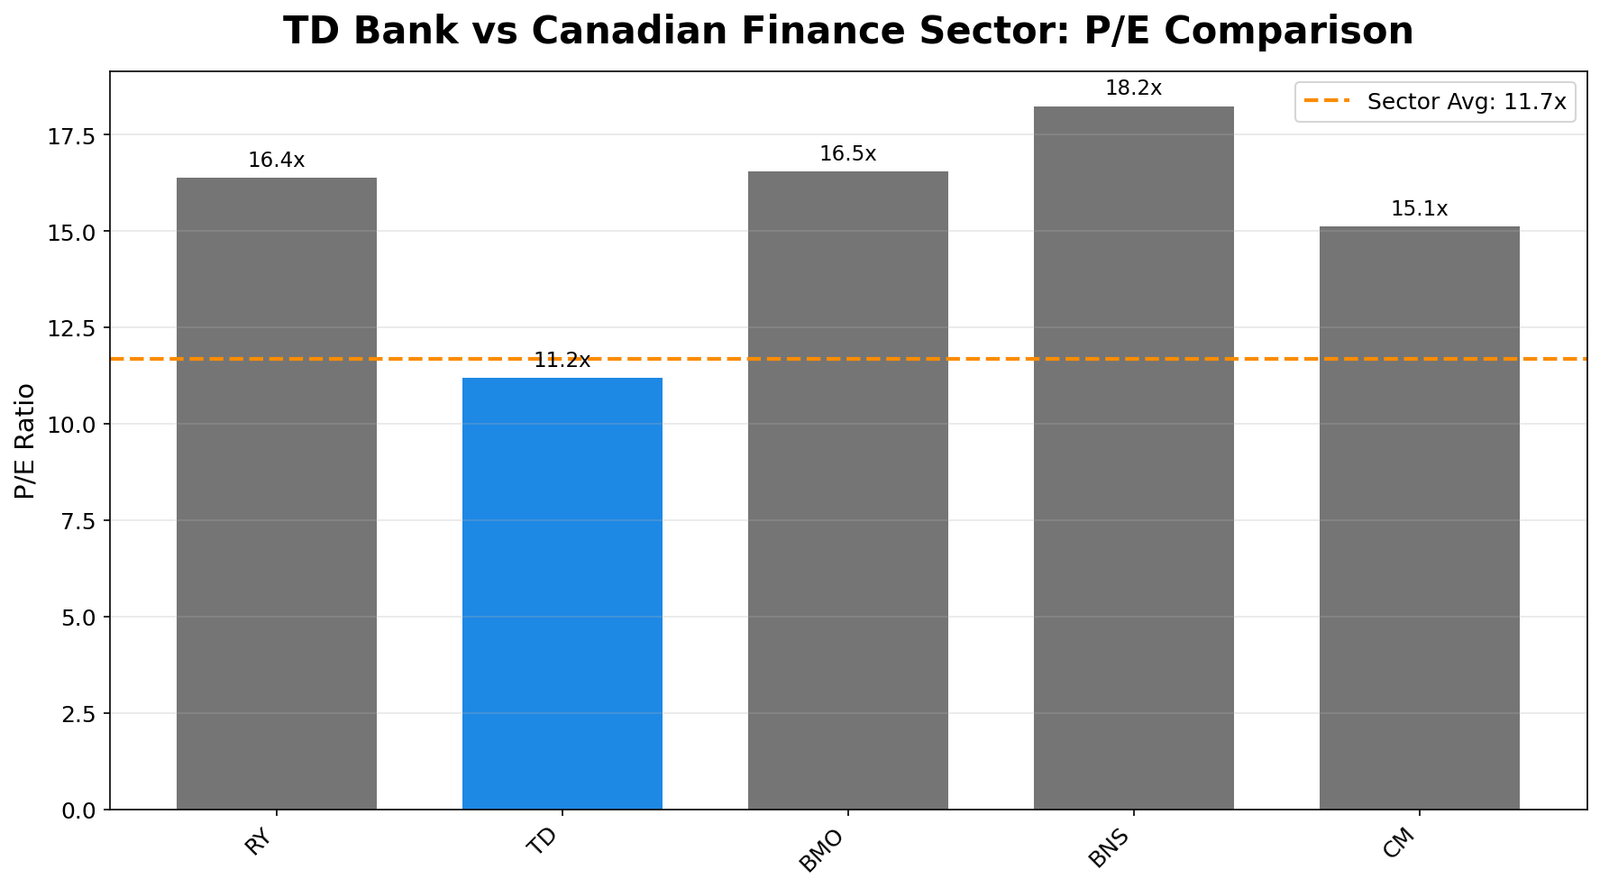
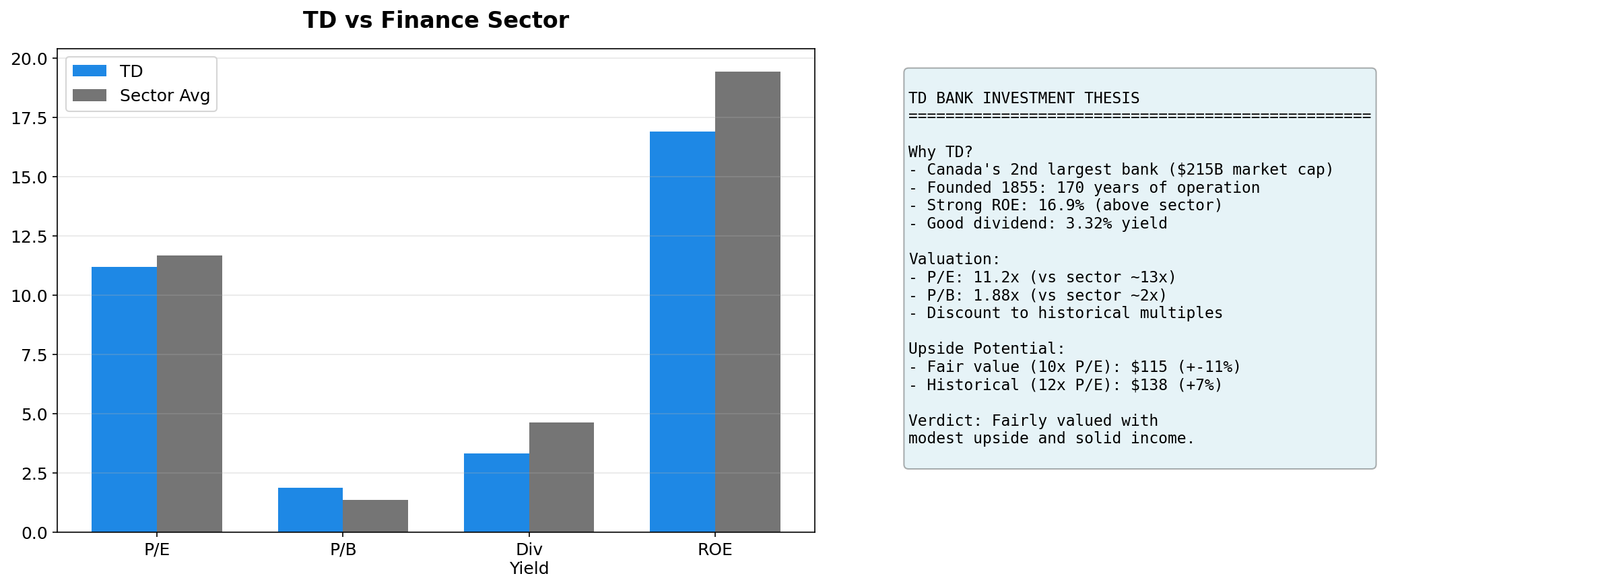
TD Bank currently trades at 11.2x P/E. To put that in perspective:
- Sector average P/E: 11.7x (modest 4% discount)
- TD P/B: 1.88x vs sector 1.35x (trading at premium)
- ROE: 16.9% vs sector 19.5%
TD is not dramatically undervalued deep value plays, but it offers quality at fair price with solid dividend income and potential for modest multiple expansion.
The Asset: Canada’s Premier Retail Banking Franchise
Before analyzing the price, let’s understand what you actually own:
- Founded: 1855 (170 years of operation)
- Market Cap: $215 billion (Canada’s 2nd largest bank)
- Business Model: Three key segments:
- Canadian Retail Banking: Largest branch network in Canada
- U.S. Retail Banking: Top 10 U.S. bank by deposits, growth engine
- Wholesale Banking: Capital markets, corporate banking
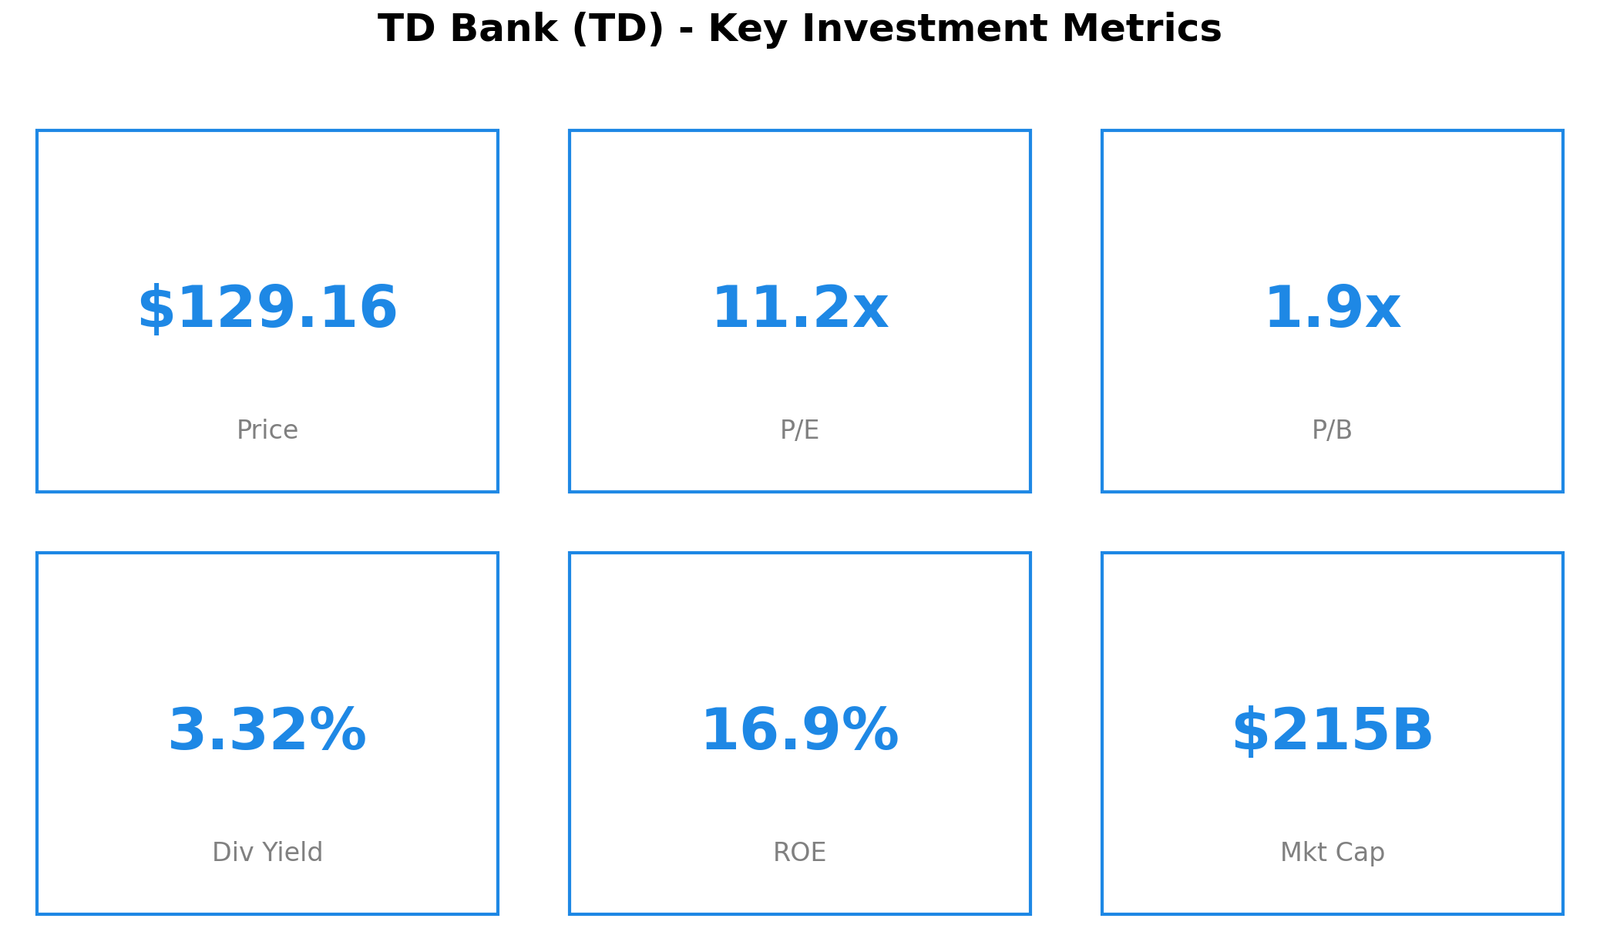
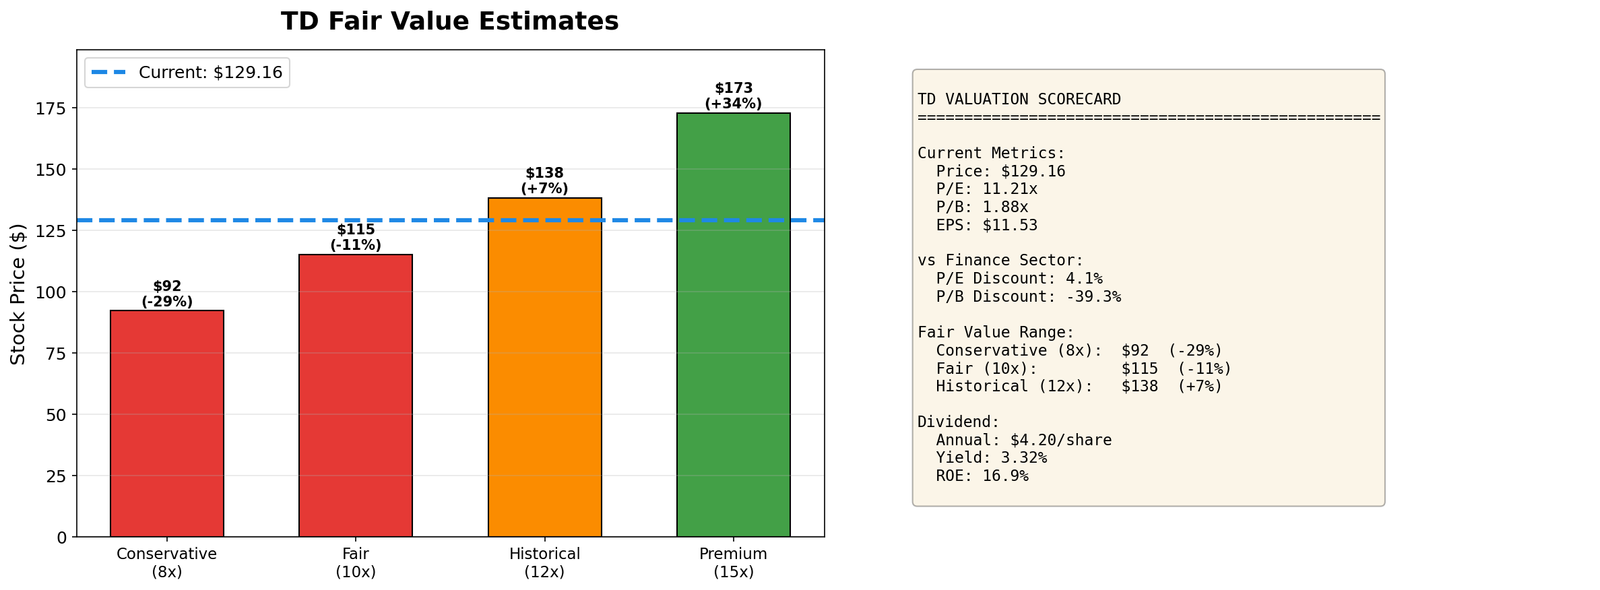
Key Stats: Price: $129.16 | P/E: 11.2x | P/B: 1.88x | Div Yield: 3.32% | ROE: 16.9% | Market Cap: $215B
Key Insight: TD is a high-quality bank with exposure to both Canadian stability and U.S. growth. The U.S. division makes TD more than just a Canadian play.
The Valuation: Fair Price for Quality
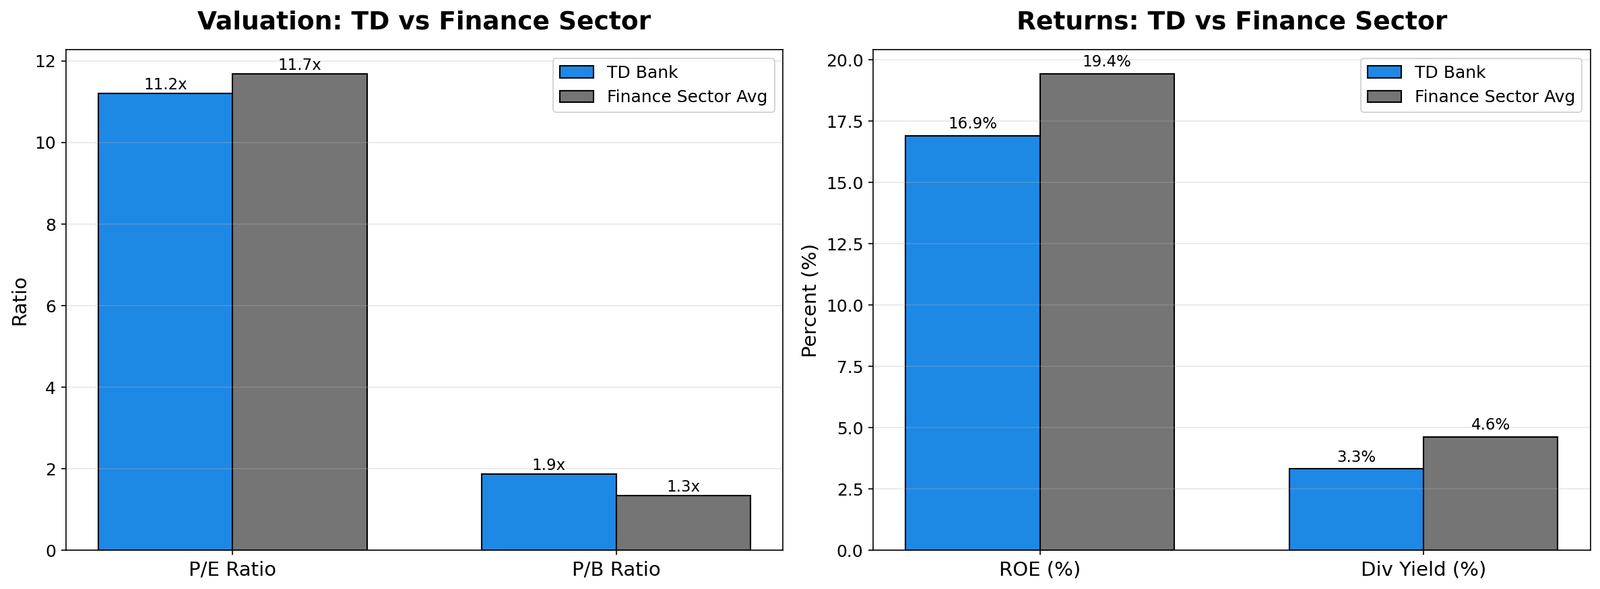
TD is trading at roughly fair value:
- P/E Ratio: 11.2x vs sector 11.7x—slight discount
- P/B Ratio: 1.88x vs sector 1.35x—premium to book
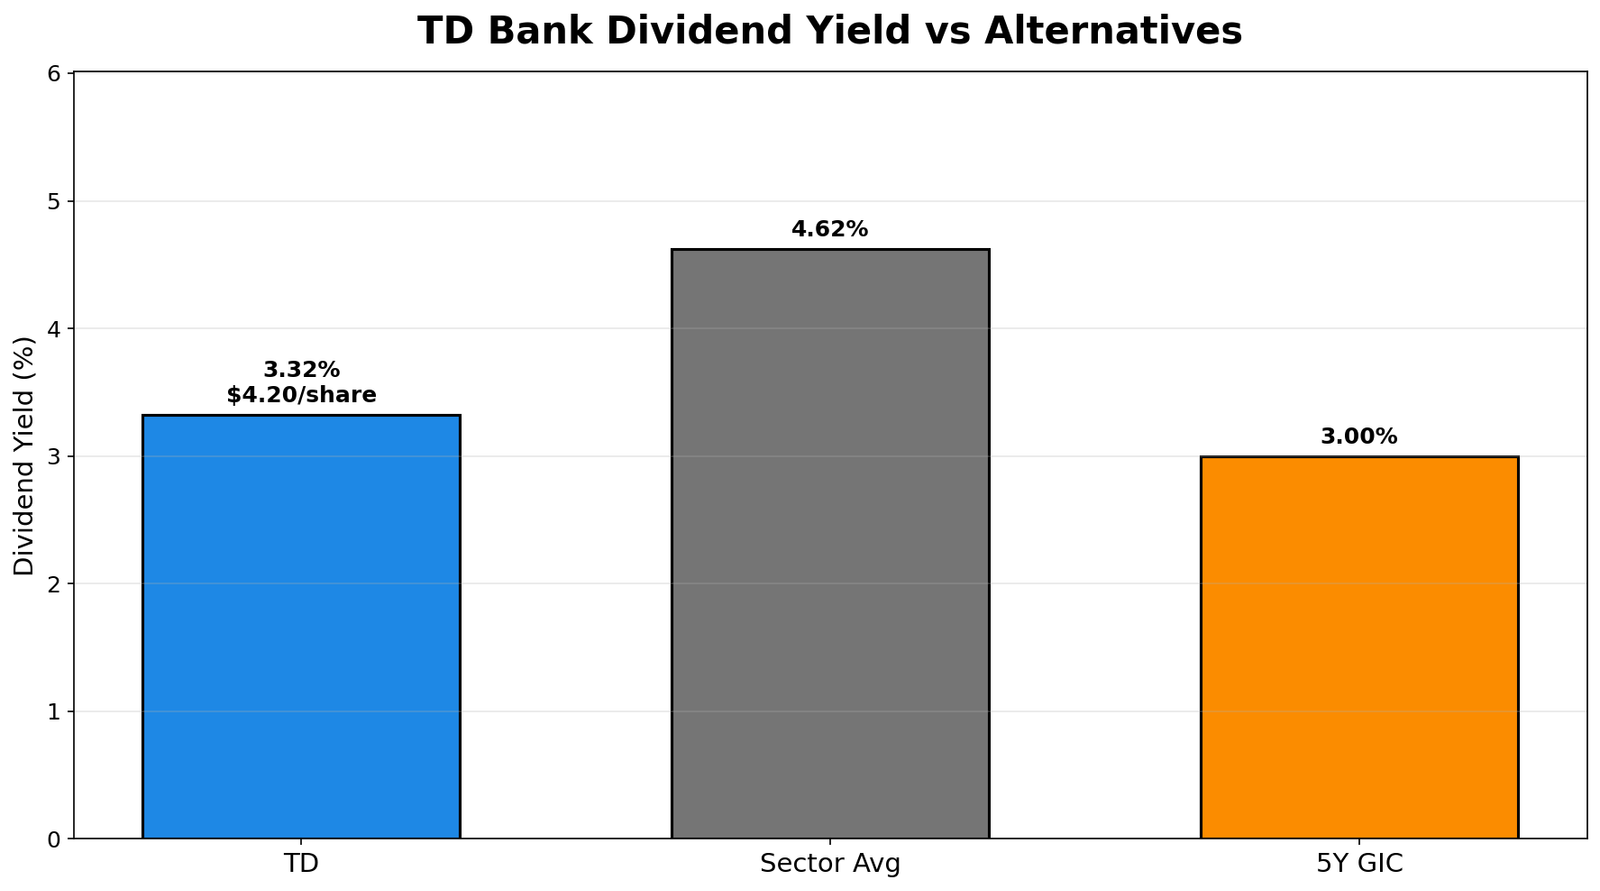
- Dividend Yield: 3.32% vs sector 4.62%—lower yield than peers
- ROE: 16.9% vs sector 19.5%
The market is pricing TD as a quality bank worth a slight premium.
Historical Context: Multiple Expansion Potential
Canadian banks have historically traded at 12-15x P/E. TD at 11.2x leaves room for upside.
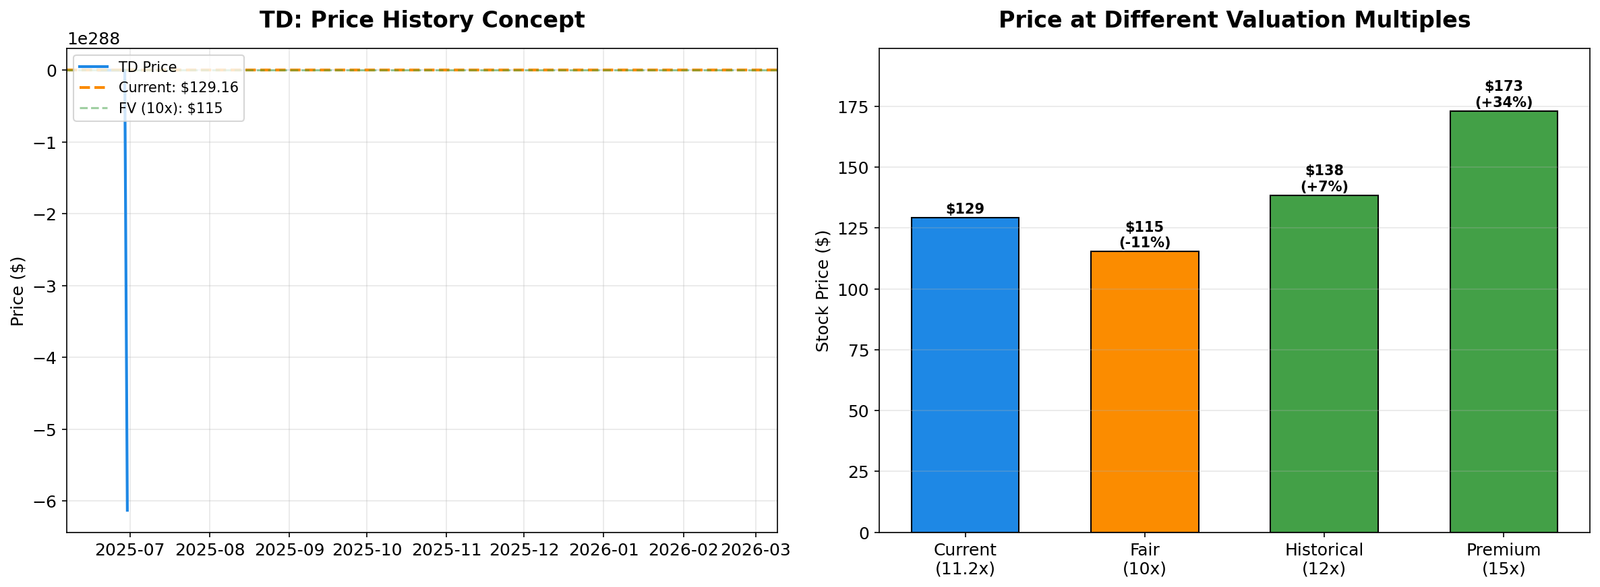
The Math: Fair Value Scenarios
Current price: $129.16 | EPS: $11.53
| Scenario | P/E Multiple | Target Price | Upside |
|---|---|---|---|
| Downside | 9x | $104 | -19% |
| Current | 11.2x | $129 | -/- |
| Fair Value | 12x | $138 | +7% |
| Historical | 13x | $150 | +16% |
Downside Risk: If Canadian housing market crashes, banks could trade down to 9x P/E (-19%).
Upside: Multiple expansion to 12-13x offers 7-16% capital appreciation plus 3.3% dividend = 10-20% total return.
The Dividend: Reliable Income
TD offers a solid dividend:
- Annual Dividend: $4.20/share
- Yield: 3.32%
- Payout Ratio: ~36% (safe and sustainable)
While the 3.32% yield is lower than some peers, the payout ratio is conservative—meaning the dividend is very safe.
Why TD Could Outperform
- U.S. Growth: TD’s U.S. retail banking is a differentiator
- Rate Cuts: Lower rates reduce credit loss provisions
- Multiple Expansion: Room to move from 11x toward 12-13x
- Conservative Management: Known for prudent risk management
- Dividend Growth: Only 36% payout ratio leaves room for increases
What Could Go Wrong
- Canadian Housing Crash: Significant mortgage exposure
- Recession: Higher unemployment leads to loan defaults
- U.S. Operations: Regulatory or economic weakness
- Multiple Compression: Banks permanently re-rated lower
Bottom Line: The Verdict
TD is not a deep value play deep value plays. It’s a quality company trading at fair value with modest upside potential.
For Income Investors: TD offers a 3.3% yield with growth potential. The dividend is safer than higher-yielding alternatives.
For Growth Investors: Modest 7-16% upside from multiple expansion, plus dividend = 10-20% total return.
For Value Investors: TD is fairly priced, not cheap. If you want deep value, look elsewhere.
My Take:
TD is a buy-and-hold forever stock for conservative investors. You’re not getting a bargain, but you’re getting quality at a fair price with solid income and modest growth.
Verdict: Suitable for dividend-growth portfolios. Not a speculative play—it’s a sleep-well-at-night bank stock.
Key Metrics Summary
| Metric | Value | Context |
|---|---|---|
| Price | $129.16 | Near fair value |
| P/E Ratio | 11.2x | 4% below sector |
| P/B Ratio | 1.88x | Premium to sector |
| Dividend Yield | 3.32% | Lower than peers |
| Market Cap | $215B | Canada’s 2nd largest |
| ROE | 16.9% | Strong profitability |
| Est. Upside | $138-150 | +7% to +16% |
Important Disclosures
This analysis is for informational and educational purposes only. It does not constitute investment advice. Always conduct your own research and consult with a qualified financial advisor before making investment decisions. Data sourced from TradingView and company filings. Analysis date: February 25, 2026.
Author may hold positions in securities mentioned. Past performance does not guarantee future results.